Montana Budget and Policy Center
Interactive Data Visualization, Fact Sheets, Animated Videos
montanabudget.org
Interactive Data Visualization
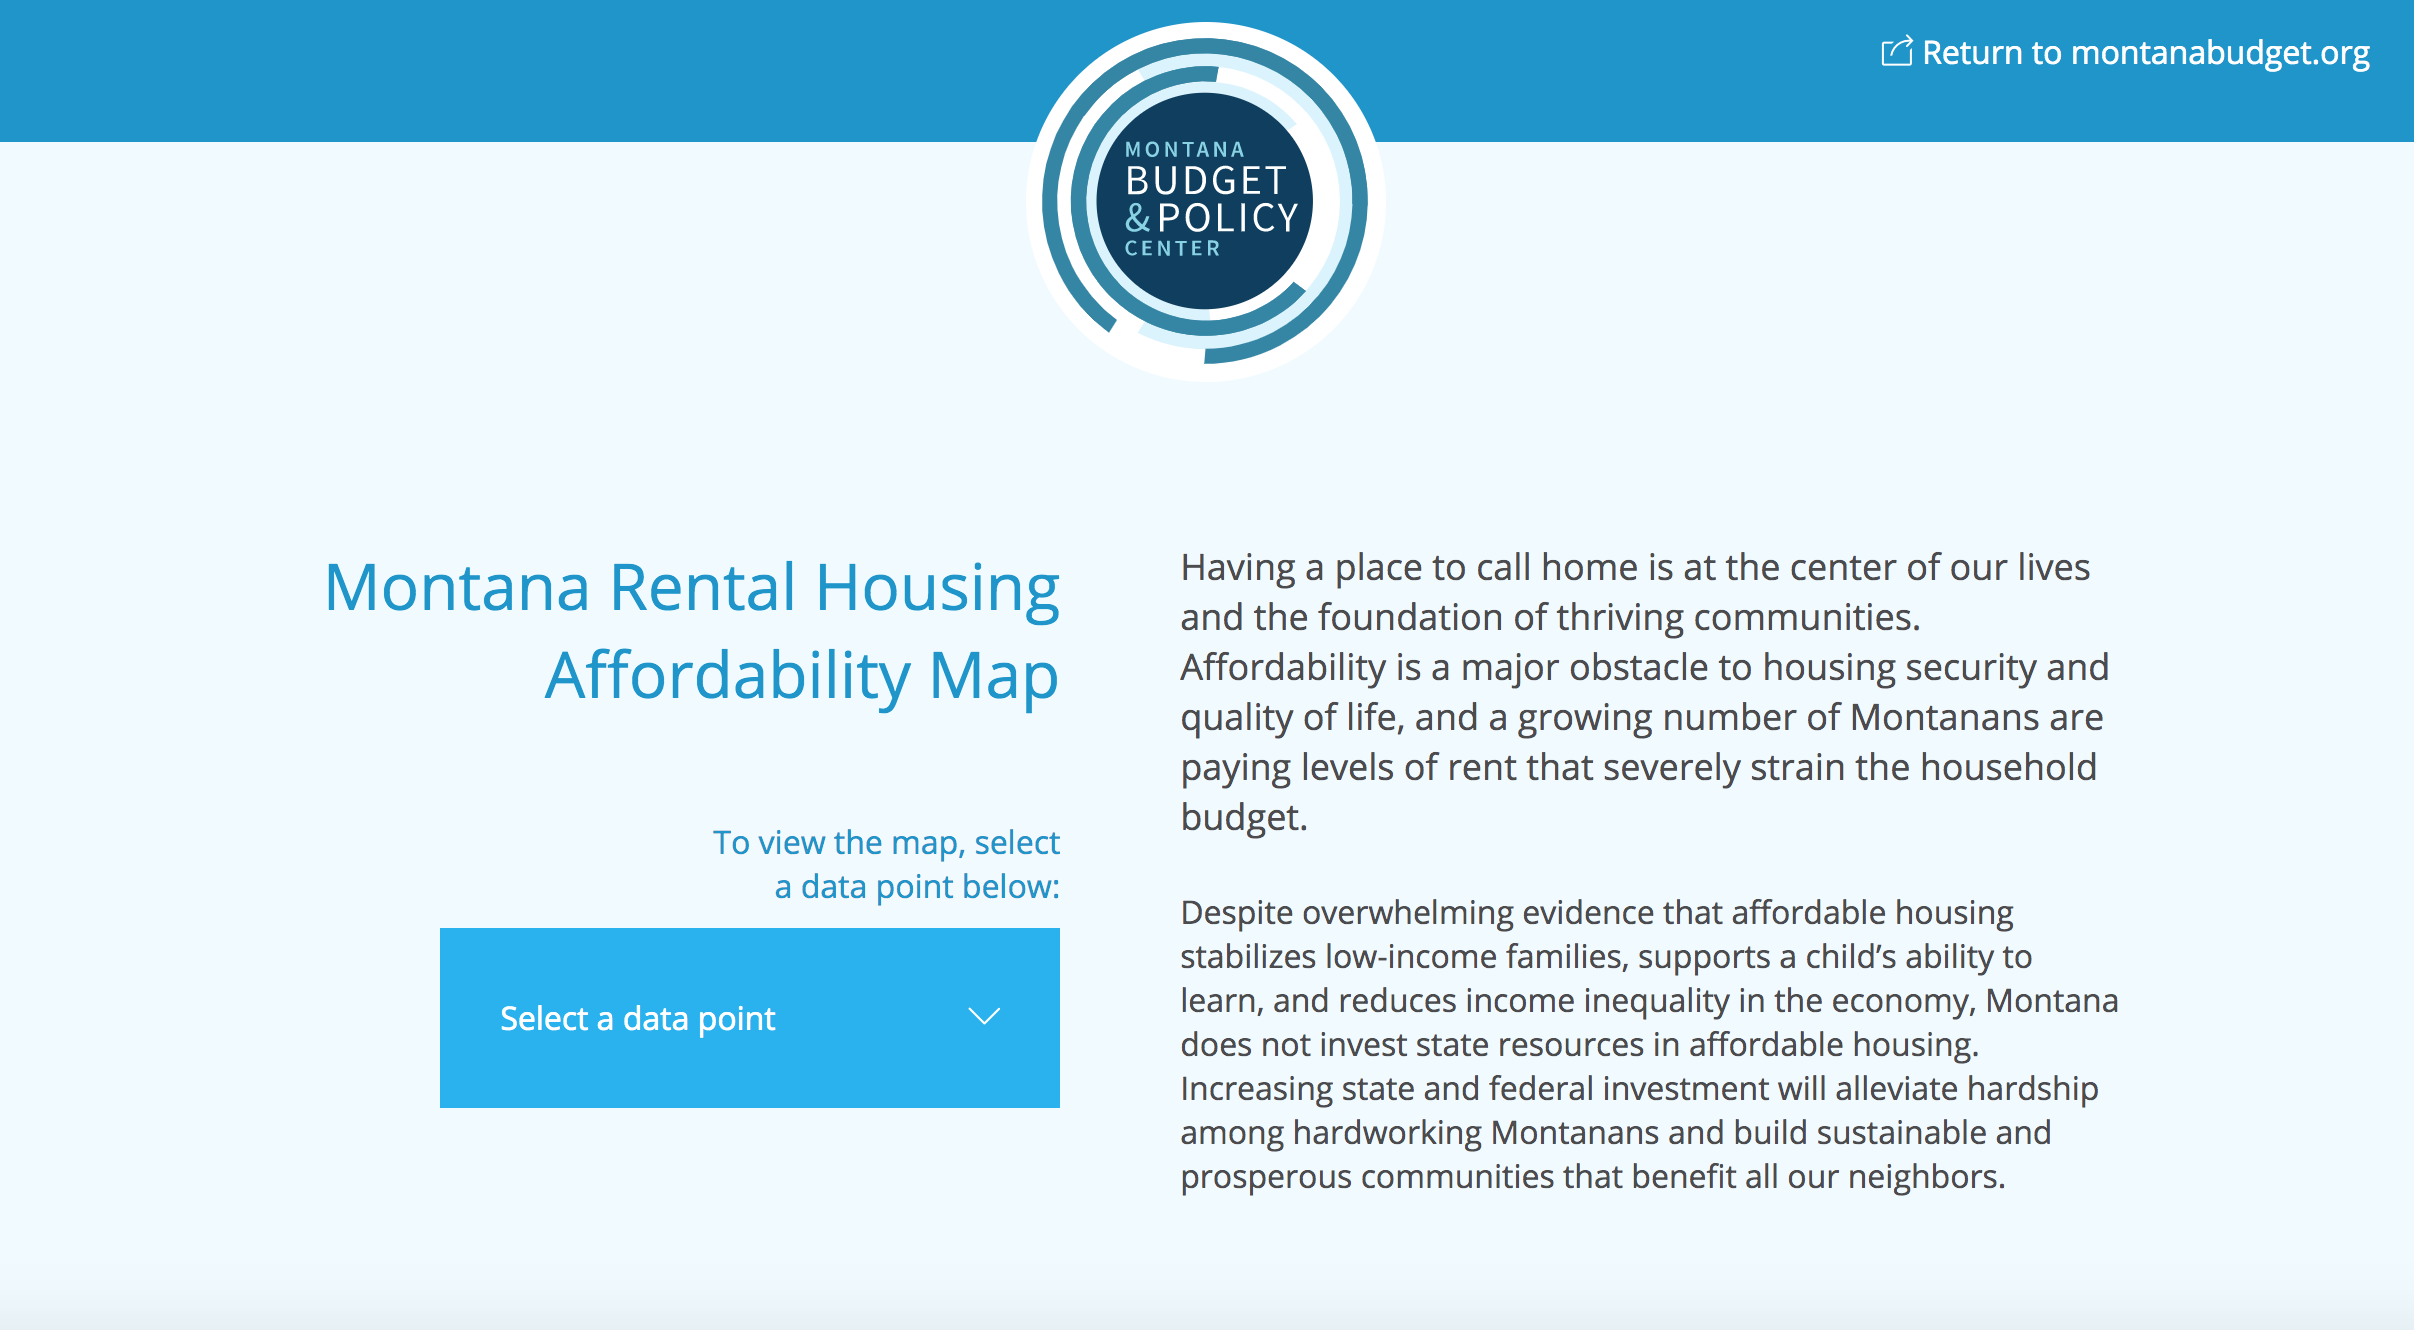
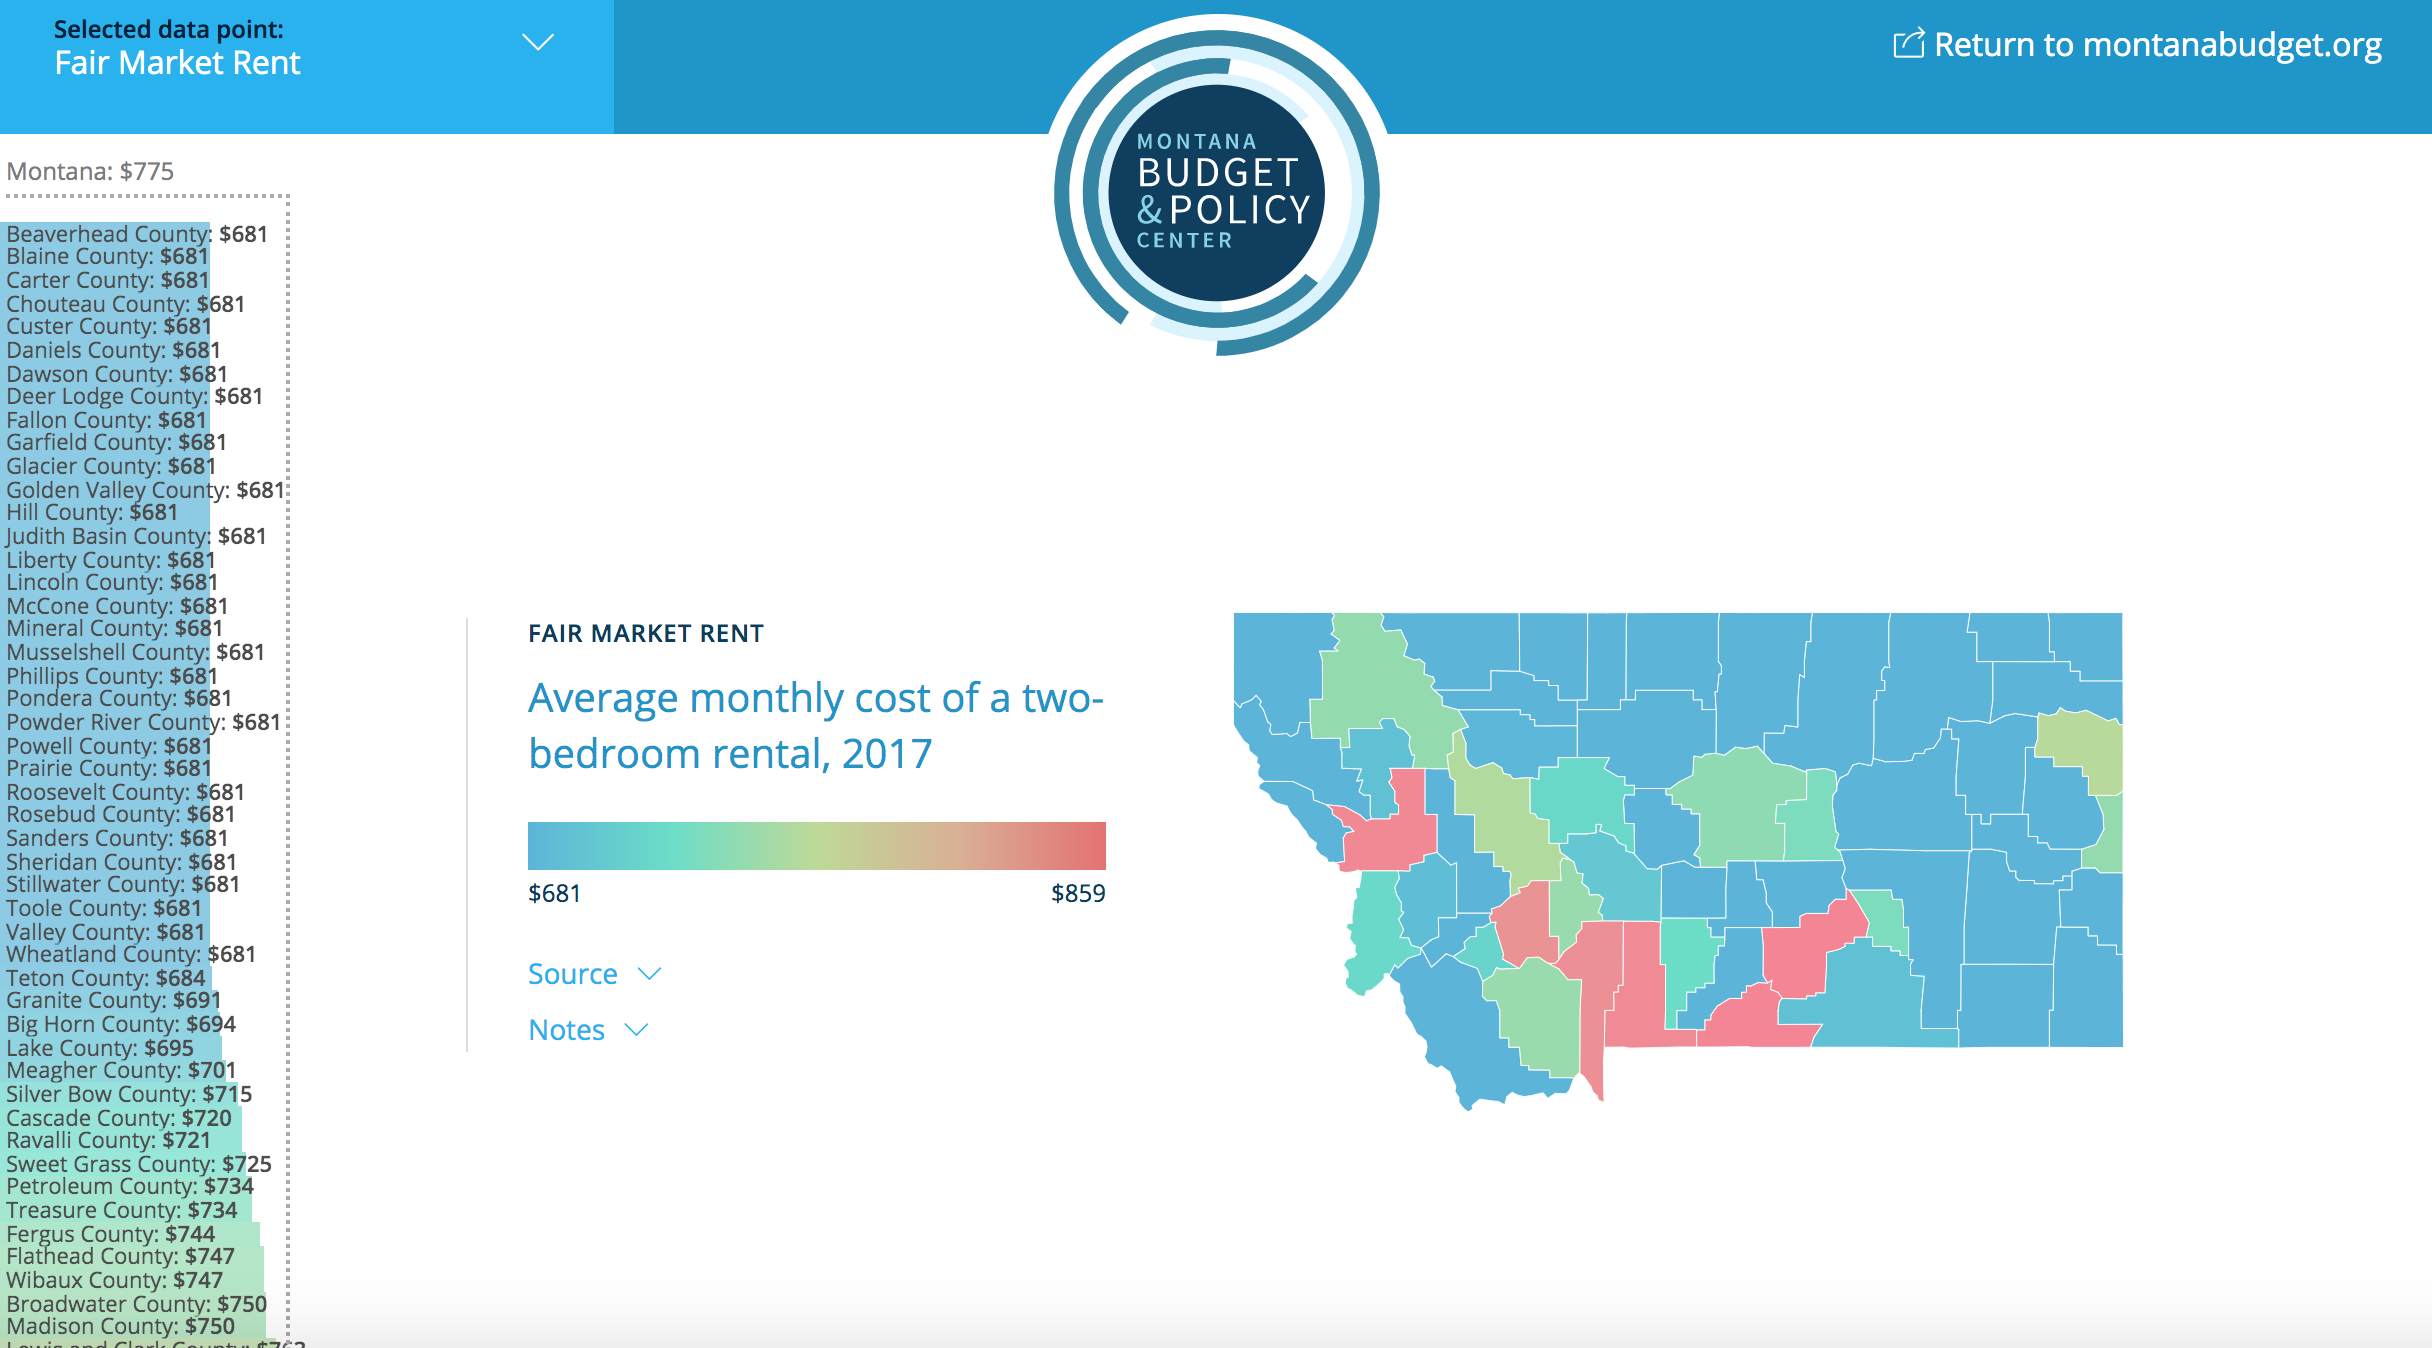
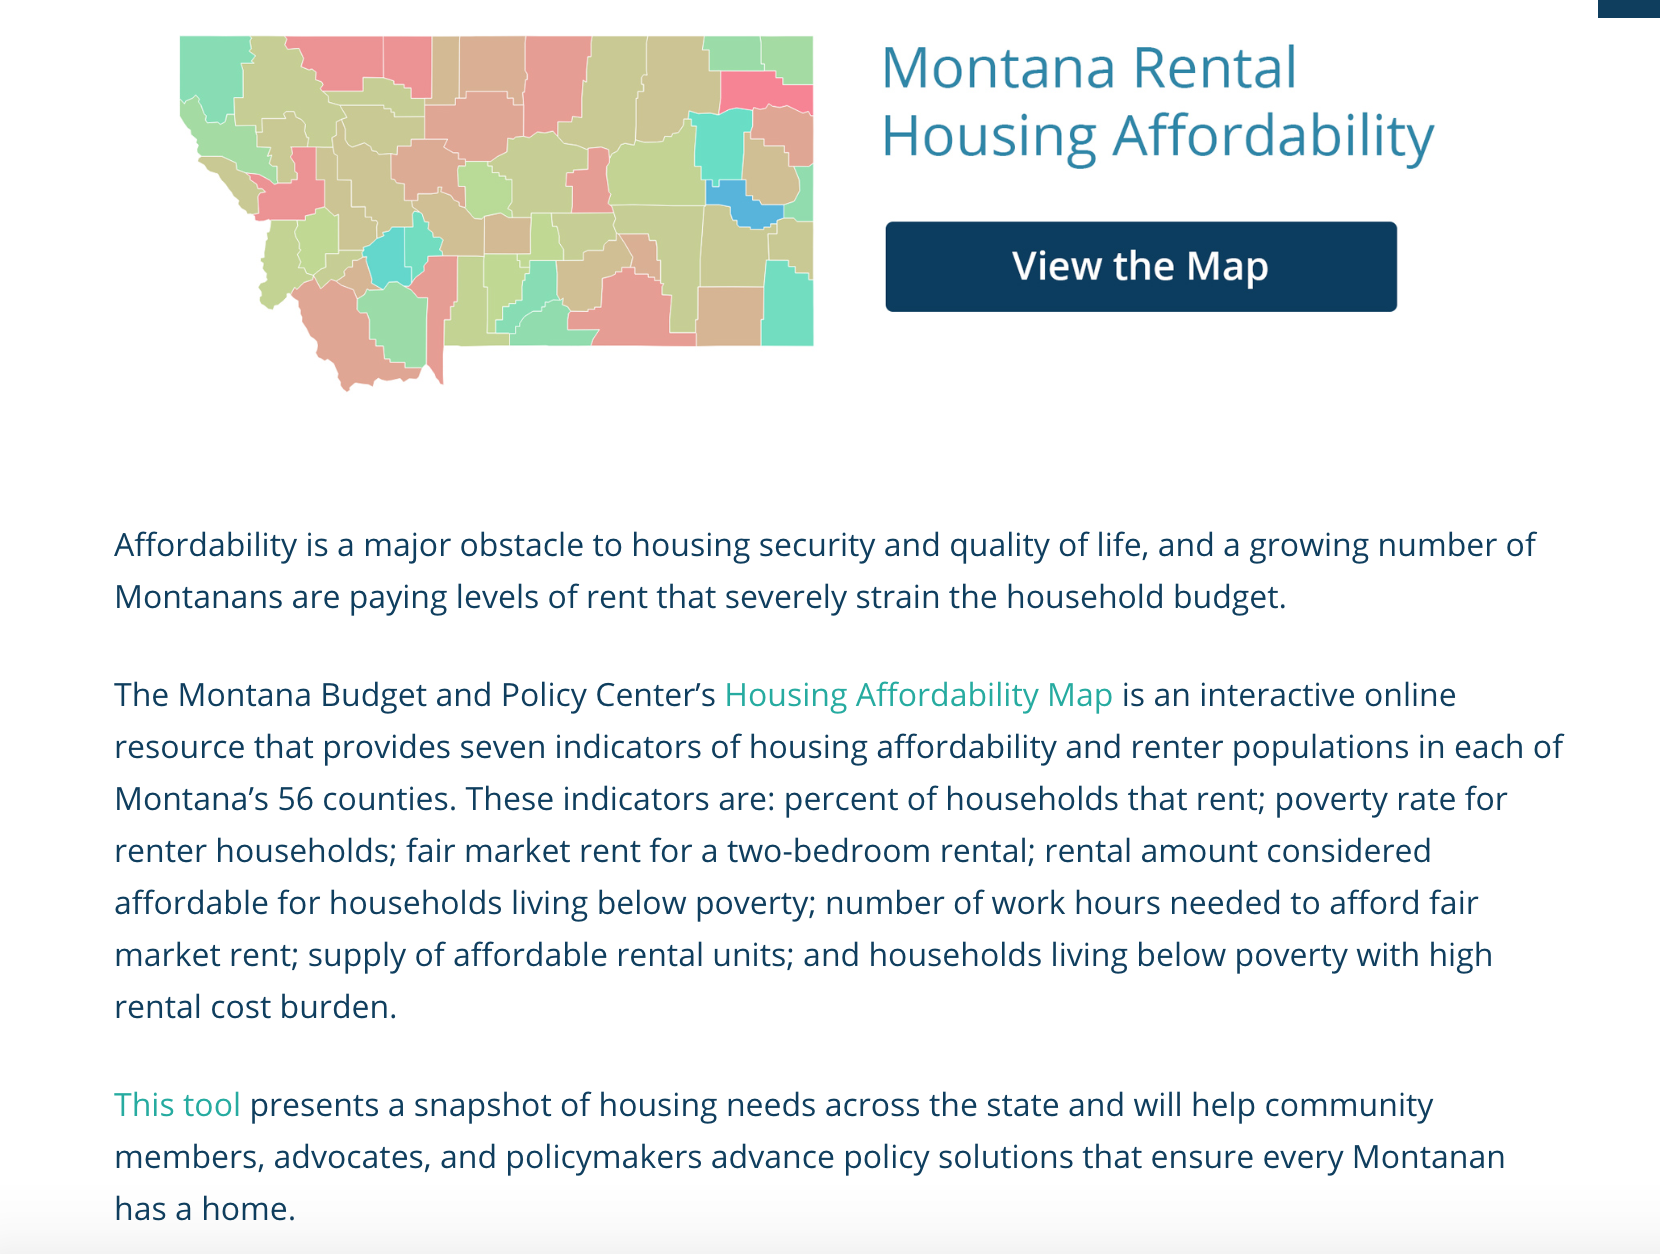
The Montana Budget and Policy Center’s Housing Affordability Map is an interactive online resource that provides seven indicators of housing affordability and renter populations in each of Montana’s 56 counties. These indicators are: percent of households that rent; poverty rate for renter households; fair market rent for a two-bedroom rental; rental amount considered affordable for households living below poverty; number of work hours needed to afford fair market rent; supply of affordable rental units; and households living below poverty with high rental cost burden.
This tool presents a snapshot of housing needs across the state and will help community members, advocates, and policymakers advance policy solutions that ensure every Montanan has a home.
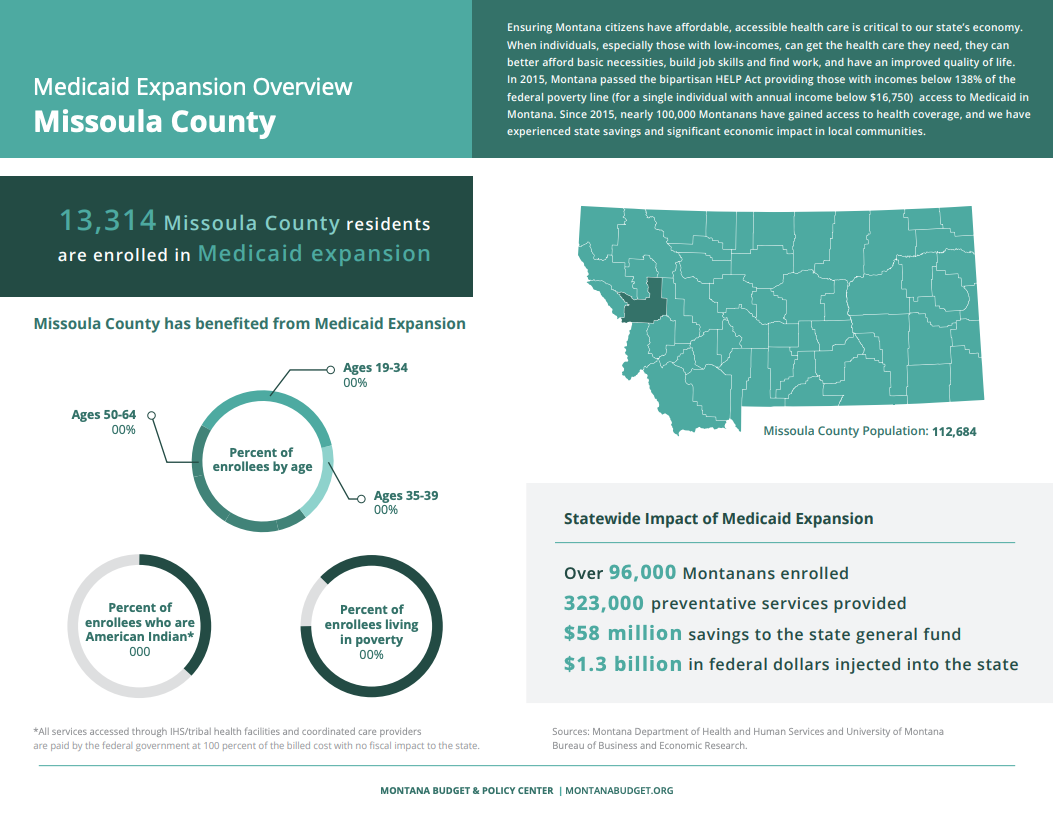
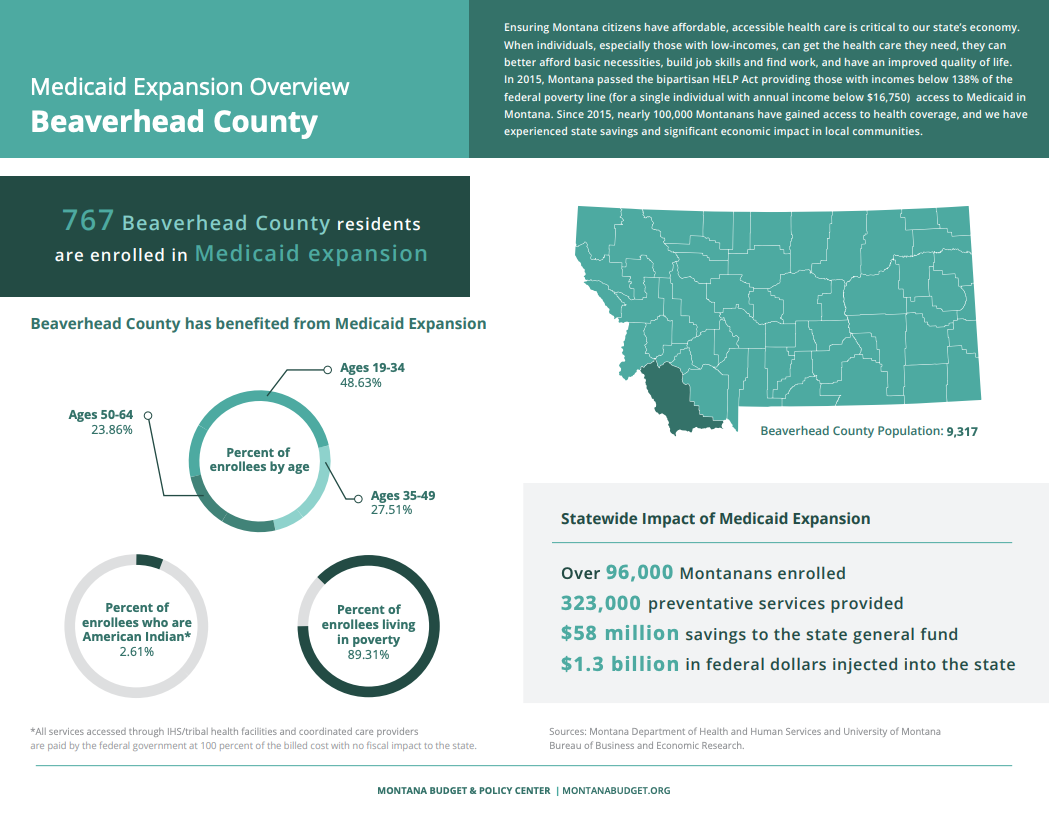
Fact Sheets
During the 2019 legislative session, the Montana Budget and Policy Center focused on ensuring Montana citizens have affordable, accessible health care. To support their work, we created fact sheets showing the impact of Medicaid Expansion in every county in Montana.
Motion Graphics
We designed and animated a series of dynamic motion graphics to help clearly illustrate complex concepts like capital gains and tax brackets.
“We were having difficulty presenting complex tax policies and making the case for why Montana needs new revenue to invest in our communities. We worked with Amy and her team to draft and refine complex language into easy to understand copy that would be short enough for social media. They took our ideas about the story we visually wanted to tell and brought it to life with thoughtful animation and music. We are very happy with the final product. ”